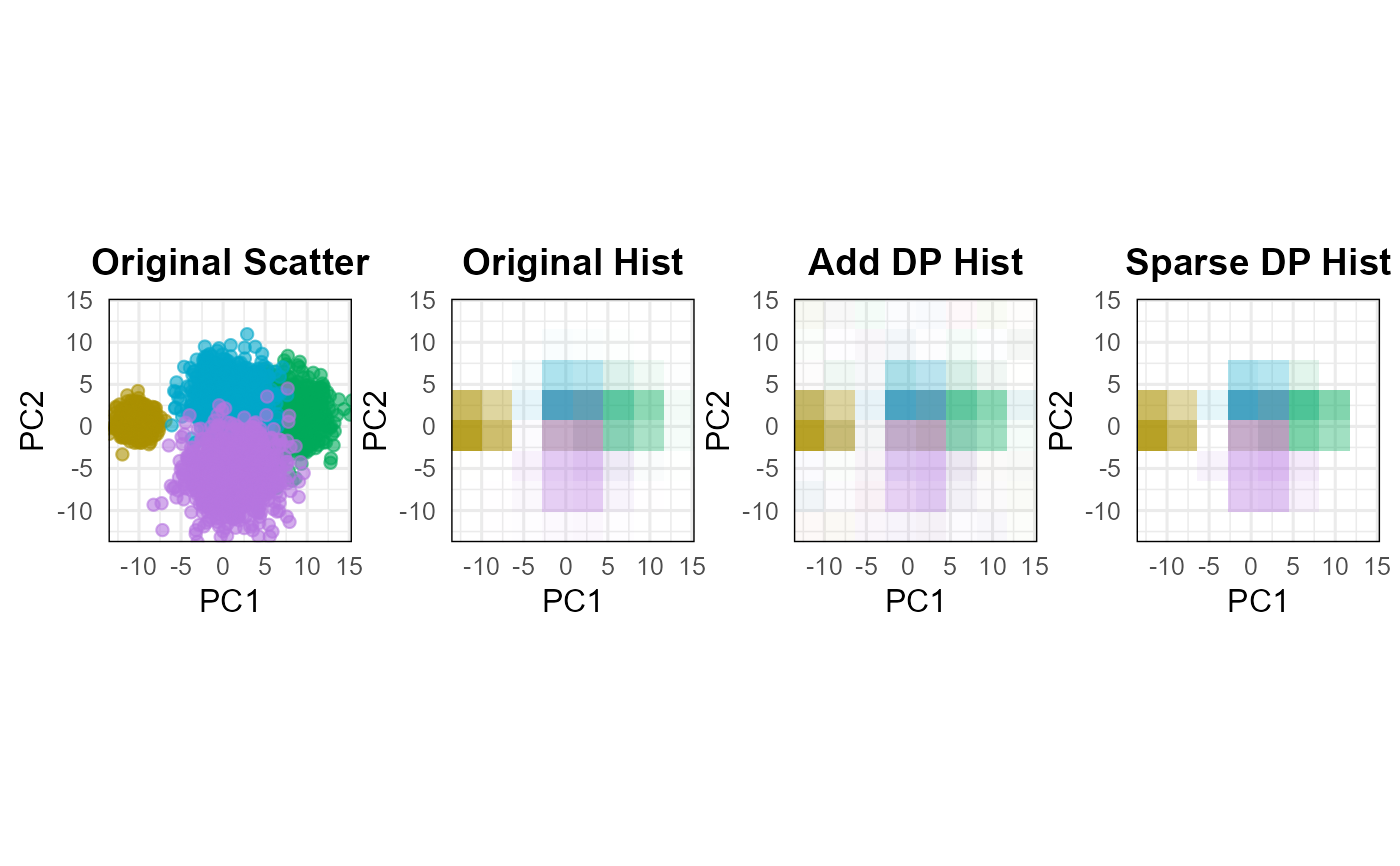
This function computes and visualizes group-wise differentially private score
histograms. It is a plotting wrapper around dp_score_group() and returns
both the computed group-wise score output and ggplot objects.
Arguments
- X
A matrix or data frame where rows correspond to observations and columns correspond to variables.
Xcan additionally include a named column representing the group label for each observation.- group
Group labels. This can be a vector of length
nrow(X)or a single column name inX. If a column name is supplied, that column is used as the group label and removed from the feature matrix.- eps
Positive number defining the total
epsilonprivacy parameter.- delta
Number in
(0, 1)defining the totaldeltaprivacy parameter.- bins
Integer vector of length 2 defining the number of histogram bins along the first and second score axes, respectively.
- center
A logical value indicating whether to center the columns of
Xbefore computing principal component directions. The default isTRUE.- standardize
A logical value indicating whether to scale the columns of
Xby their sample standard deviations after optional centering. The default isFALSE.- g_dppca
A logical value indicating whether to use private principal component directions. The default is
FALSE. Seedp_pc_dir()for details.- cpp.option
A logical value passed to
dp_pc_dir()wheng_dppca = TRUE. The default isFALSE.- axes
Integer vector of length 2 specifying the principal components used to construct the score coordinates. The default is
c(1, 2).- method
Character vector specifying which private histogram methods to compute. Use
"add"for the additive Gaussian histogram and"sparse"for the sparse thresholded histogram. The default isc("add", "sparse").
Value
A list with components:
- score
The output of
dp_score_group().- plot
A list containing group-wise histogram plots.
- group_colors
Named vector of colors used for the groups.
See also
dp_score_group() for computing group-wise score histograms without
plotting.
dp_score_plot() for pooled score histogram plots.