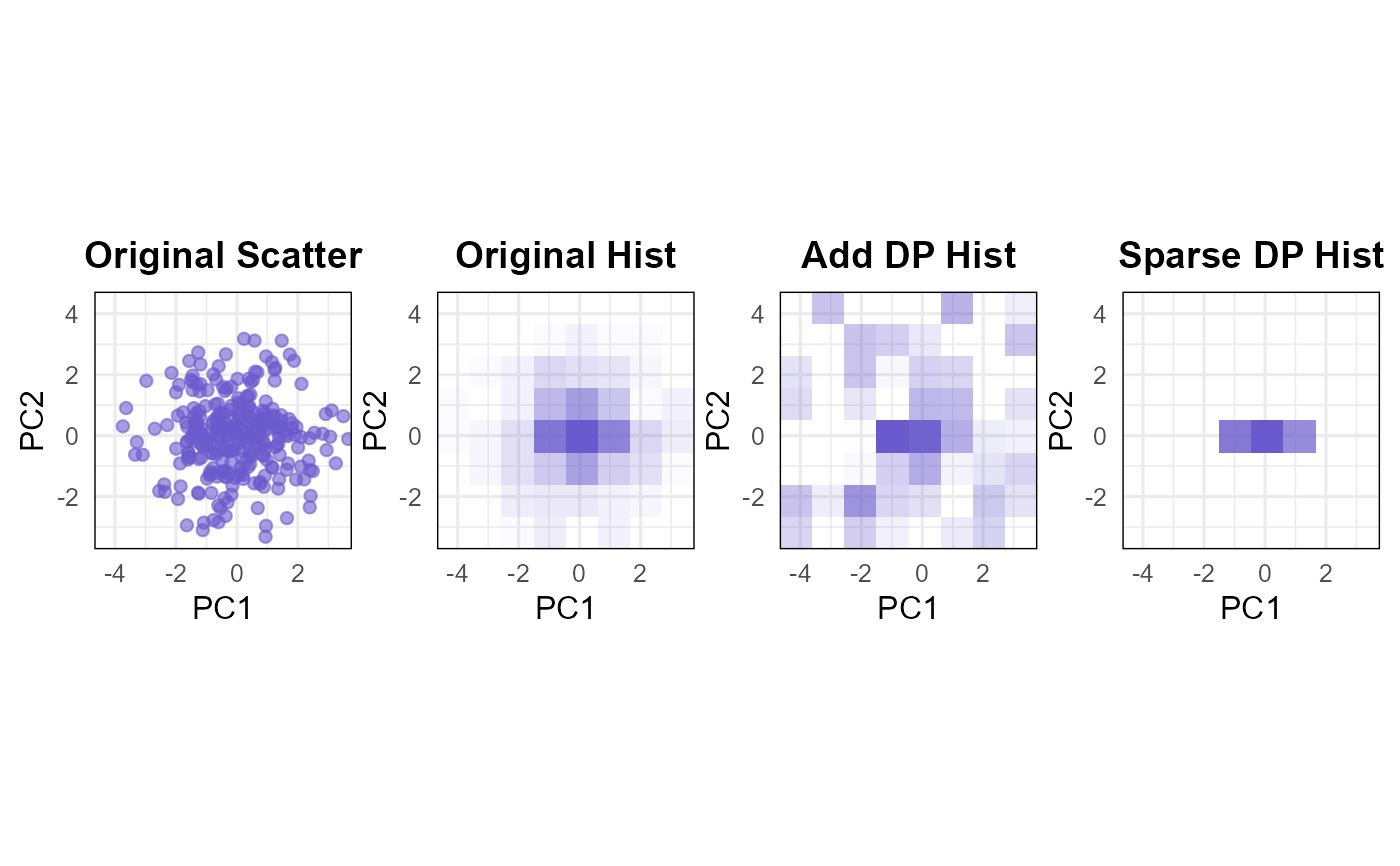
This function computes and visualizes two-dimensional principal component
score histograms, including the original scatter plot, the non-private
empirical histogram, and one or more differentially private histogram
estimates. It is a plotting wrapper around dp_score() and returns both the
computed score output and ggplot objects.
Arguments
- X
A numeric matrix or data frame. Rows correspond to observations and columns correspond to variables.
- eps
Positive number defining the total
epsilonprivacy parameter.- delta
Number in
(0, 1)defining the totaldeltaprivacy parameter.- bins
Integer vector of length 2 defining the number of histogram bins along the first and second score axes, respectively.
- method
Character vector specifying which private histogram methods to compute. Use
"add"for the additive Gaussian histogram and"sparse"for the sparse thresholded histogram. The default isc("add", "sparse").- center
A logical value indicating whether to center the columns of
Xbefore computing principal component directions. The default isTRUE.- standardize
A logical value indicating whether to scale the columns of
Xby their sample standard deviations after optional centering. The default isFALSE.- g_dppca
A logical value indicating whether to use private principal component directions. The default is
FALSE. Seedp_pc_dir()for details.- cpp.option
A logical value passed to
dp_pc_dir()wheng_dppca = TRUE. The default isFALSE.- axes
Integer vector of length 2 specifying the principal components used to construct the score coordinates. The default is
c(1, 2).
Value
A list with components:
- score
The output of
dp_score().- plot
A list containing the scatter plot, histogram panels, and the combined patchwork plot.
See also
dp_score() for computing score histograms without plotting.
dp_score_plot_group() for group-wise score histogram plots.
Examples
data(gau, package = "dppca")
# Use a small subset to keep the example fast.
X <- gau[1:300, ]
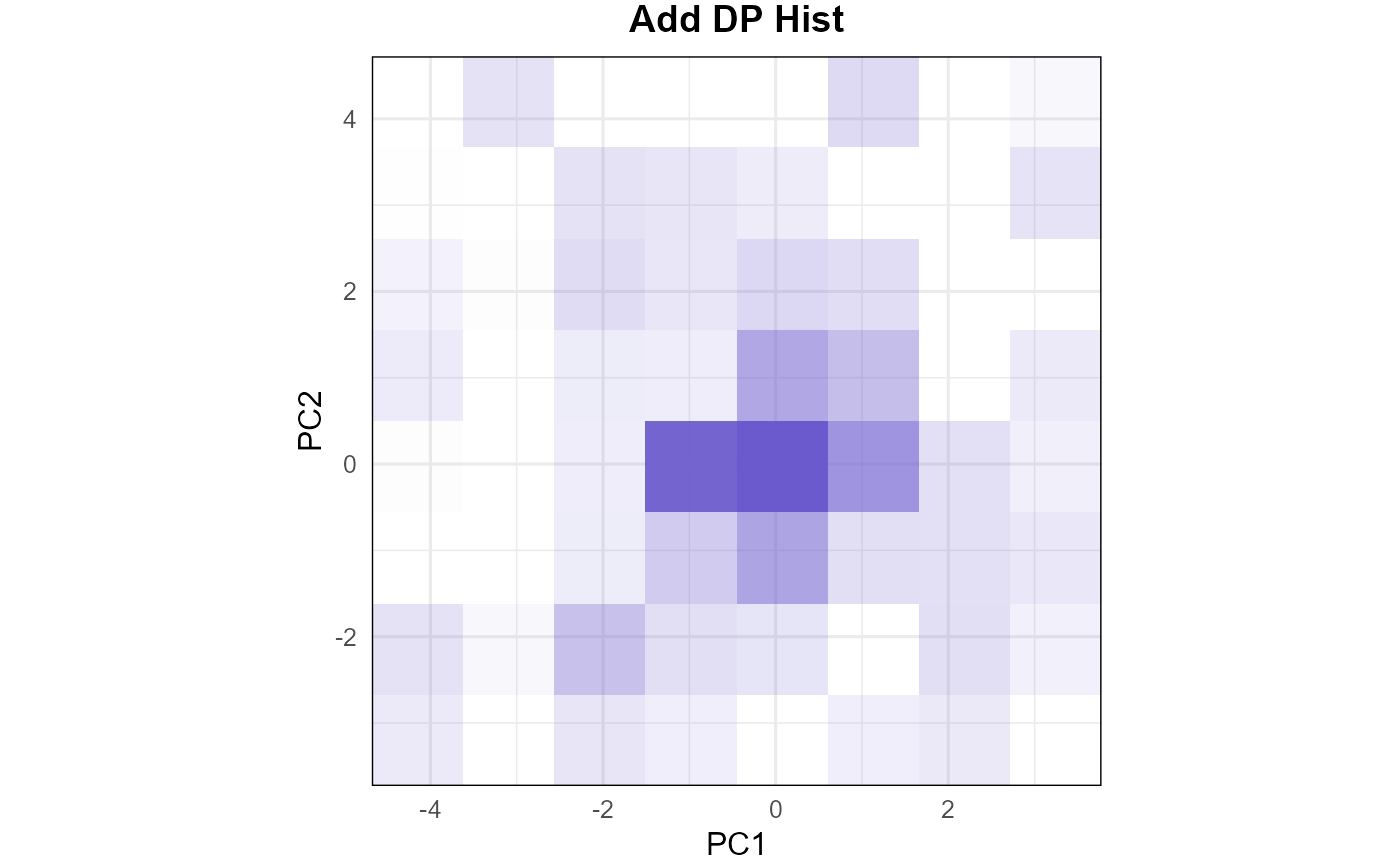
# Draw a private score plot using the additive histogram method.
set.seed(123)
score_plot <- dp_score_plot(
X,
eps = 3,
delta = 1e-3,
bins = c(8, 8),
method = "add"
)
score_plot$plot$add
 # Draw score plots for all available histogram methods.
set.seed(123)
score_plot <- dp_score_plot(
X,
eps = 3,
delta = 1e-3,
bins = c(8, 8)
)
score_plot$plot$all
# Draw score plots for all available histogram methods.
set.seed(123)
score_plot <- dp_score_plot(
X,
eps = 3,
delta = 1e-3,
bins = c(8, 8)
)
score_plot$plot$all